


Table of Contents Show
Distribution transformers are arguably the costliest equipment in power distribution. Failed transformers are difficult to replace. Especially, during times of cyclones, floods or other such natural calamities. This causes power outage for a large group of houses or commercial establishments. Therefore, for both cost and reliability considerations, the choice of transformers plays a huge part in a DISCOM’s procurement strategy. The choice becomes even more complex given the wide range of transformer manufacturers in the country.
In this case study, the author shows how to use hypothesis testing as a decision making tool in transformer procurement. The case study was first submitted to Professor Shubhabrata Das as a part of the course “Data to decisions” at Indian Institute of Management, Bangalore.
Case study background
Prathibha is facing a similar dilemma. She works as Head (Procurement) for a power DISCOM in a coastal city in India. The city power distribution company procures transformers from M’sons – a reputed OEM with over 60 years of history in manufacturing transformers. Recently, an upcoming brand, P’Tech has submitted a proposal to Prathibha offering 10% lower price than M’sons.
P’Tech has good credentials, but lacks experience. So, if their Mean Time Before Failure (MTBF) is poorer than M’sons, it may result in a higher life cycle cost due to the associated repair requirements. It may also increase customer dissatisfaction since transformer failures result in longer duration power outages for connected consumers. In such a scenario, the 10% upfront cost reduction (due to discount) wouldn’t help. On the other hand, if P’Tech has at least the same MTBF as M’sons, the deal would be beneficial to the DISCOM.
Data collection
It is a common practice for DISCOMs to record the failure rate of distribution transformers in terms of percentage failures out of the total population. However, Prathibha noted that failure rate would not be useful for comparison between suppliers. It would be rather helpful if she could analyse the Time Before Failure (TBF) for each manufacturer to arrive at a clear decision and that too for similar rating transformers and similar working conditions. Therefore, she started contacting other DISCOMs in the vicinity which had similar climatic conditions. This, she thought could help reduce the bias in data due to different operating conditions, negating the corrosive effect coastal regions have on the life of transformers. She required 30 TBF data points for each manufacturer so that the data would follow a normal distribution (aka bell curve).
Breakthrough
Eventually, Prathibha managed to collect 30 TBF data points each for M’sons and P’Tech transformers from neighbouring coastal regions. In all cases, the failures could be attributed to manufacturing defects. She could use this data for hypothesis testing in transformer procurement. She decided to award P’Tech the chance to supply only if they can match (or better) M’sons’ performance at a significance level of 5%. Sample data of TBF is given in number of days of operation before failure. The data she collected is tabulated below for the reader’s reference –
| Serial Number | M’sons transformers | P’tech transformers |
|---|---|---|
| 1 | 2,666 | 2,876 |
| 2 | 3,281 | 3,219 |
| 3 | 5,533 | 2,443 |
| 4 | 4,336 | 3,554 |
| 5 | 3,603 | 2,559 |
| 6 | 3,774 | 2,988 |
| 7 | 3,259 | 2,950 |
| 8 | 3,135 | 3,066 |
| 9 | 3,227 | 2,303 |
| 10 | 3,066 | 3,132 |
| 11 | 2,821 | 2,044 |
| 12 | 3,270 | 2,701 |
| 13 | 3,165 | 3,066 |
| 14 | 2,661 | 2,292 |
| 15 | 3,446 | 2,157 |
| 16 | 3,311 | 3,369 |
| 17 | 2,946 | 2,070 |
| 18 | 1,832 | 2,245 |
| 19 | 1,697 | 3,066 |
| 20 | 3,628 | 3,384 |
| 21 | 1,690 | 2,785 |
| 22 | 1,500 | 3,542 |
| 23 | 3,329 | 3,121 |
| 24 | 3,493 | 2,723 |
| 25 | 1,905 | 2,446 |
| 26 | 1,559 | 3,380 |
| 27 | 2,365 | 3,106 |
| 28 | 2,405 | 2,263 |
| 29 | 3,482 | 4,612 |
| 30 | 1,511 | 3,154 |
Forming the hypothesis
Prathibha realises that there may be a slim chance of error in her calculation (significance level of 5%). She decides it would be better if P’Tech gets selected due to the error even though undeserving rather than the other way round. The other way would be P’Tech not getting selected even though it has better or ‘at-par’ performance with M’sons. This is called alpha error. She can now form the null hypothesis as “MTBF of P’Tech is greater than or equal to MTBF of M’sons” while the alternate hypothesis shall be “MTBF of P’Tech is less than MTBF of M’sons”
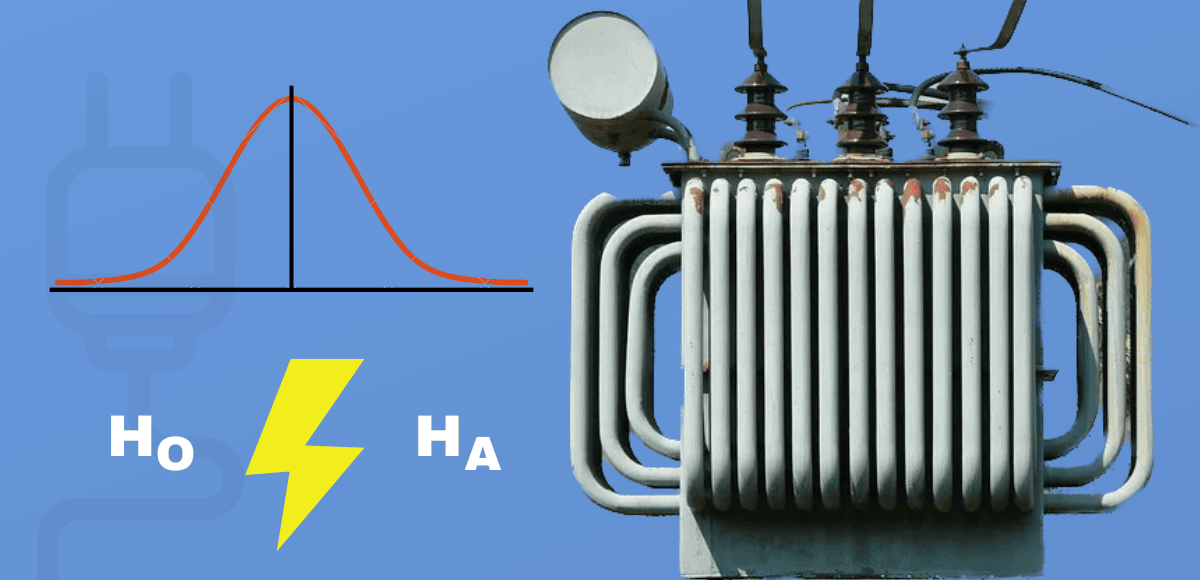
H0 – MTBF (P’Tech) > = MTBF (M’sons)
HA – MTBF (P’Tech) < MTBF (M’sons)
She maps the data on to an excel sheet and starts number crunching to test the hypothesis.
Analysing the results
First off, Prathibha observes that the Mean Time Before Failure (MTBF) of P’Tech was 2,887 days. This was lower than MTBF of M’sons at 2,930 days. So, the data says that on an average, M’sons transformers fail in 2,930 days while P’Tech transformers fail in 2,887 days on average. Most of her colleagues would conclude that M’sons was the better supplier and move ahead to favour M’sons in their procurement decision. But not Prathibha. She understood that averages are just one metric out of the many. Maybe this result could be attributed to just chance. If she could find 30 more data points, how likely would it be that she would get the same results? Not very likely it seems.
A large part of correct data analysis is to separate signal from noise
For your reference, the average, standard deviation and standard error for both manufacturers are tabulated below with the excel formulae used –
| Parameters | M’sons | P’tech | Excel formula |
|---|---|---|---|
| Mean Time Before Failure (MTBF in days) | 2,930 | 2,887 | =AVERAGE(range) |
| Standard deviation (SD) | 913 | 557 | =STDEV(range) |
| Standard error | 166.60 | 101.74 | =SD/SQRT(n) |
As given in table 2 above, data from M’sons is a normal distribution with mean at 2,930 days, standard deviation of 913 days and standard error of 166.6 days. On the other hand, data from P’tech is another normal distribution with mean at 2,887 days, standard deviation of 557 days and standard error of 101.7 days.
Hypothesis testing in transformer procurement
Data from both normal distributions above can be used to construct another normal distribution to test the hypothesis. Mean of this new normal distribution would be zero since the null hypothesis assumes equality in MTBF of both transformer manufacturers. The standard error would be square root of the sum of squares of the standard errors in table 2. This would result in Standard error of 195.2 days (Excel formula = SQRT(SE12 + SE22).
X (sample mean) will be the difference of MTBF (P’Tech) and MTBF (M’sons) = 2,887 – 2,930 = – 43.
Now, as this will be a left-tailed test and therefore, p-value can be found by using the excel formula – =NORM.DIST(X,0,SE,TRUE) = NORM.DIST(-43,0,195.2,TRUE) = 41.33%.
Result of hypothesis test
Prathibha remembers that if the p-value is high, the “null hypothesis flies high”. On the other hand, if the p-value is low, the “null has to go”. As the p-value is higher than 10 %, the Null hypothesis holds good. Thus, in this case, contrary to the view of her colleagues, P’Tech should be given a chance to supply the transformers.
Alternate scenarios
In the case given above, while P’Tech has marginally lesser MTBF than M’sons, the p-value turned out to be in favour of P’Tech. One reason for this is the high standard deviation of M’sons (913 days). However, if standard deviation of M’son would have been much lower, say about 500 – 600, it turns out that the result could have been much different as the p-value would be lower.
Conclusion
Prathibha’s case demonstrates that tracking MTBF for distribution transformers can be much helpful for decision making rather than just tracking the failure rate of transformers. It shows the use of hypothesis testing in transformer procurement. Therefore, the author advocates for DISCOMs to track this useful parameter in order to enable more informed decisions through statistics and data.
Do let me know in the comments what you feel about Prathibha’s approach.
This case, along with the characters, companies and data used are hypothetical and just constructed to prove a point.
Hey Gaurav, wonderful case to demonstrate the use of p value to make business decisions. Also many thanks for making us revise the whole concept.